


Fidelity Analysts See Bitcoin’s 52% Drop as Market Maturity
Bitcoin's decline is less severe, indicating market maturity and reduced volatility.
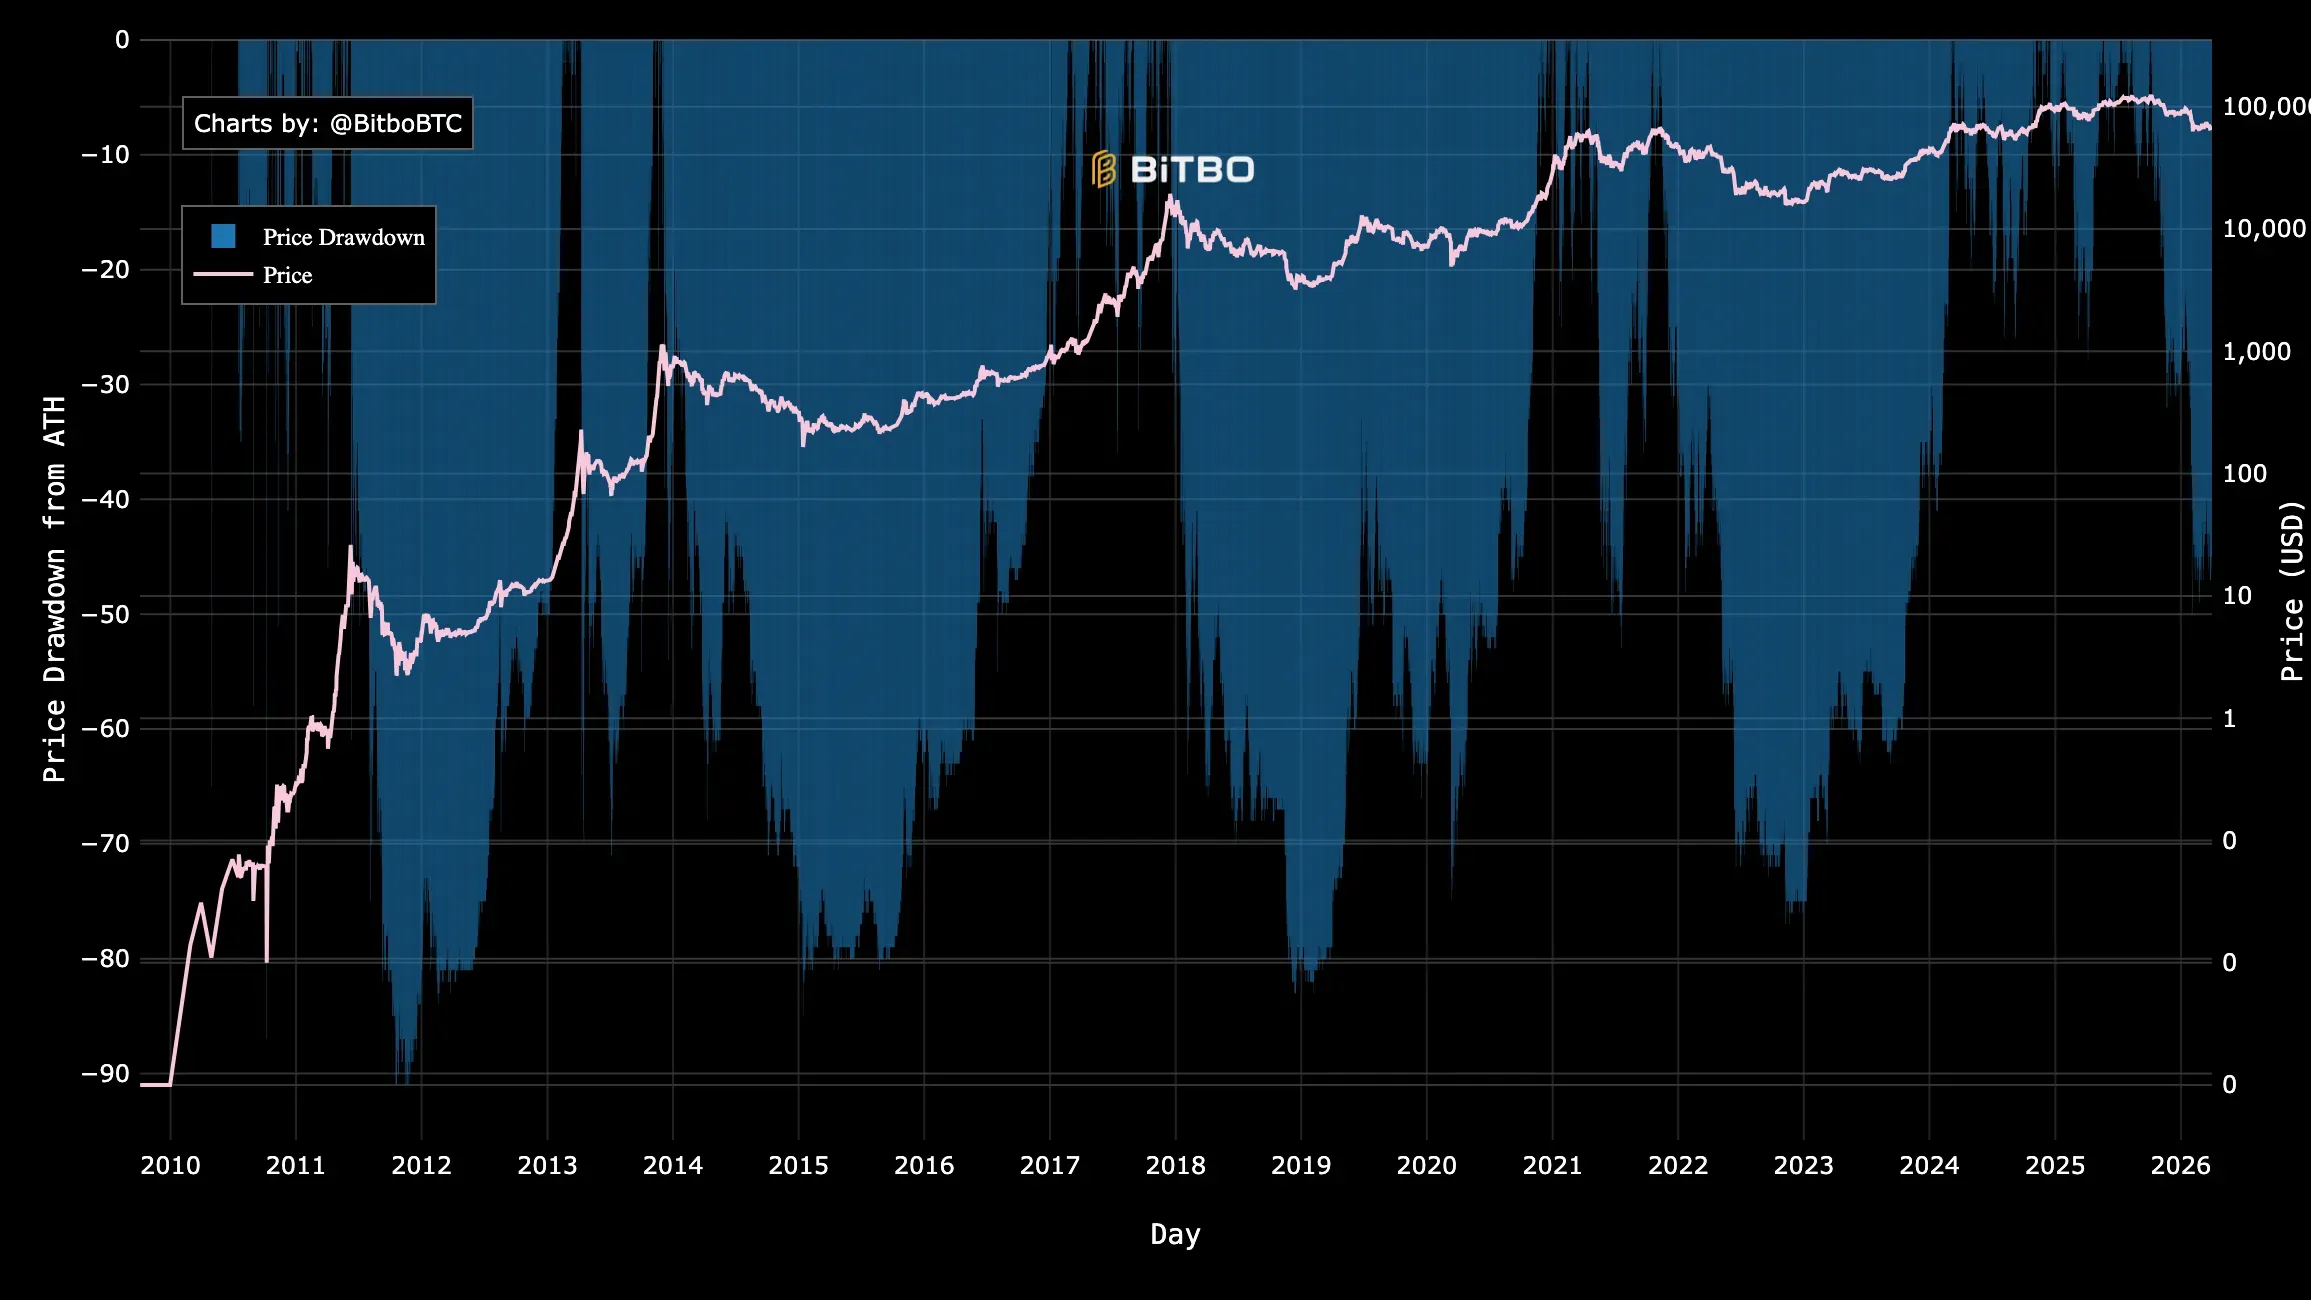
In the current market cycle, Bitcoin’s decline has been significantly less severe than in previous periods, reports Cointelegraph, citing Fidelity Digital Assets.
Analyst Zach Wainwright noted that in the past, after reaching all-time highs (ATH), the first cryptocurrency’s prices would plummet by 80-90%. Now, the declines after peaks are not as steep, and this trend is likely to continue.
Changing Market Dynamics
According to Wainwright, when evaluating price dynamics relative to previous peaks, there is a noticeable decrease in the return on investment in digital gold.
“With each new cycle, growth becomes less impulsive. The risk of a deep fall in 2026 has also decreased,” the expert emphasized.
On February 6, Bitcoin reached a potential bottom of the current cycle around the $60,000 mark. This is 52% below the all-time high near $126,000 recorded on October 6. Currently, the asset trades 45% below the peak values of six months ago.
During the previous bear market, the decline was more severe. Prices then fell by 77%—from the 2021 high ($69,000) to below $16,000 in November 2022.
Bottom Already in Late September?
The less severe decline indicates market maturation, reduced volatility, and increased confidence from institutional investors, stated LVRG Research Director Nick Rack in a comment to the publication.
“Bitcoin is transforming from a speculative asset into a more stable store of value. In the long term, this paves the way for its widespread adoption,” he added.
Alphractal founder João Vedson noted that Bitcoin’s local maximum was reached on the 534th day after halving—much faster than in the previous cycle.
“Pattern fading” indicates the formation of a market bottom between the 912th and 922nd day after the miner reward reduction. According to the expert’s estimates, this stage is expected in late September or early October 2026.
Technical Picture
At the time of writing, Bitcoin is trading below the 50- and 200-day exponential moving averages (EMA), which serve as indicators of the long-term trend.
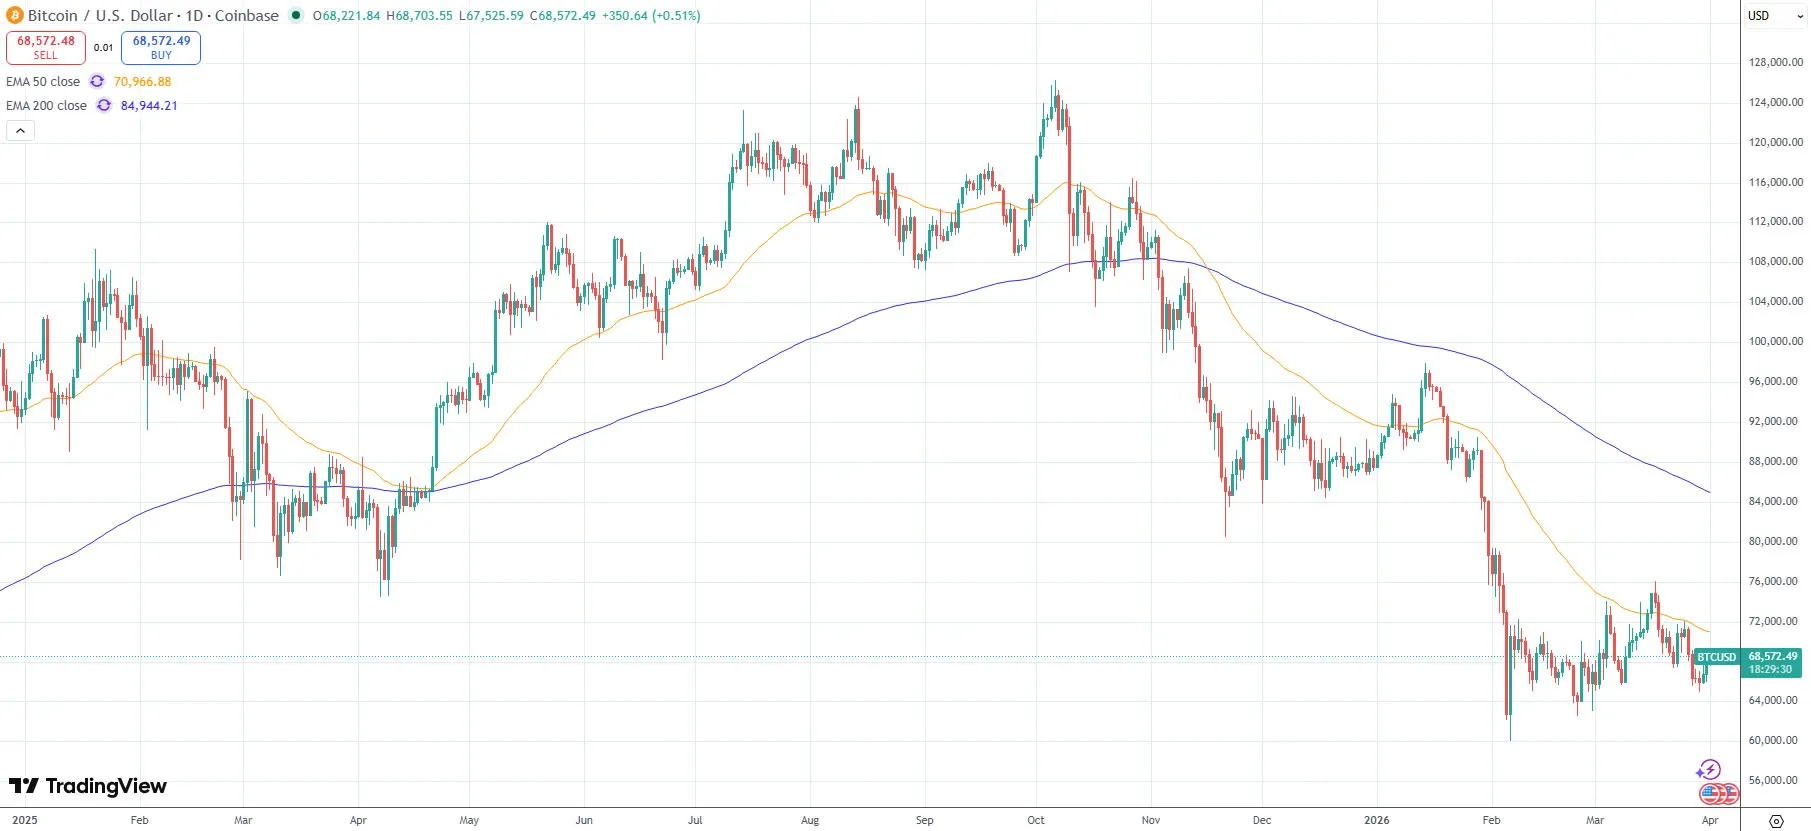
Meanwhile, the asset consolidates around the $69,000 mark—above the 200-week EMA, which has historically served as a significant zone of dynamic support during corrections within bear market phases.
As reported, amid market weakness, Ethereum outperformed Bitcoin in price dynamics.
Рассылки ForkLog: держите руку на пульсе биткоин-индустрии!