


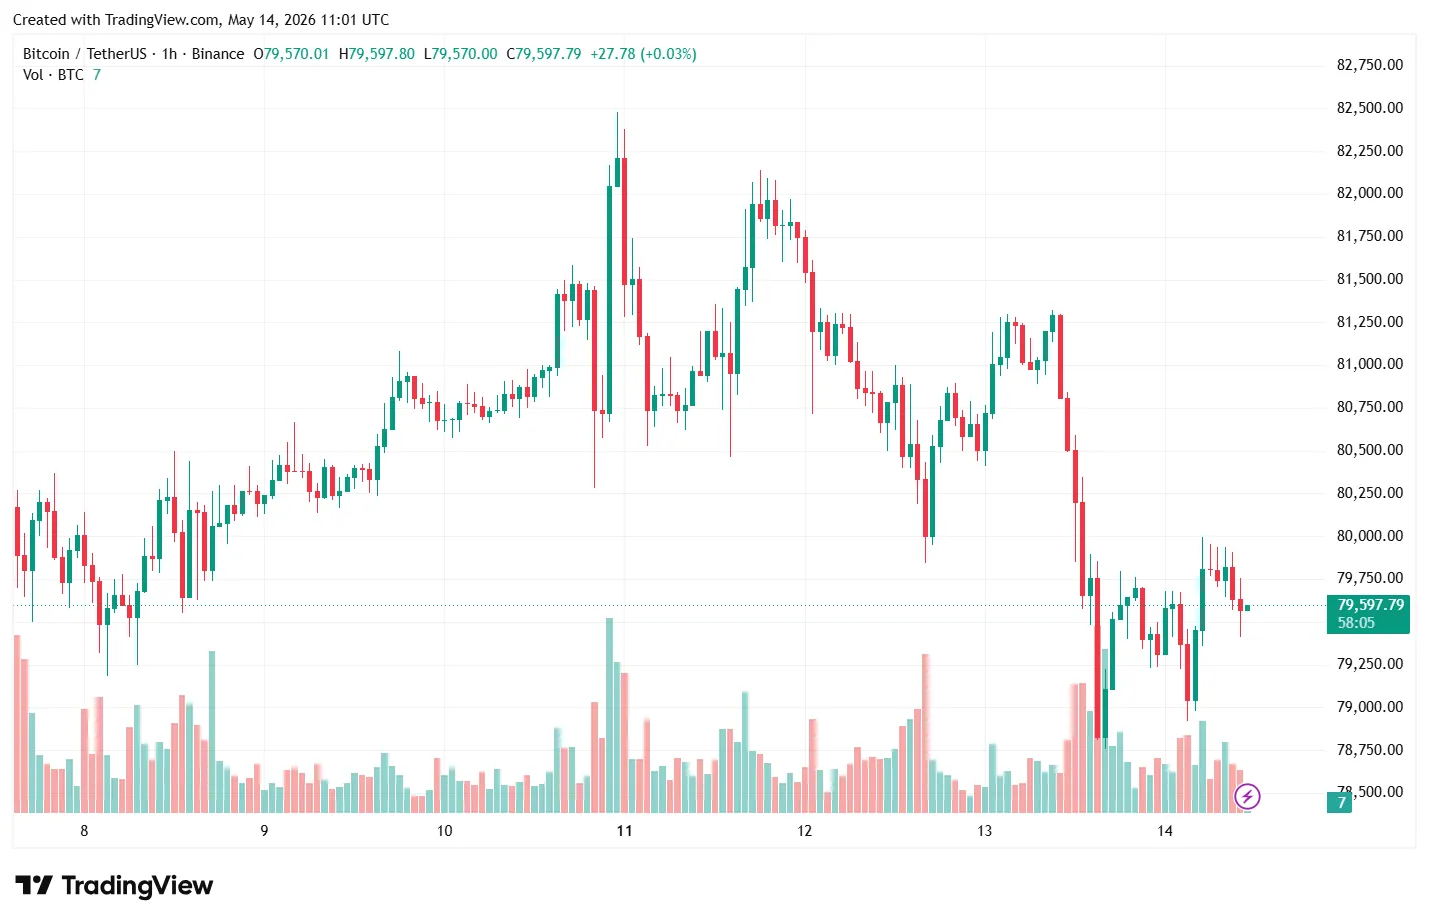
On May 13, bitcoin fell below $80,000. The pullback coincided with the publication of April’s producer price index (PPI): it rose by 1% — the highest reading since March 2022.


Annual core producer inflation reached 5.2%, beating expectations of 4.3%. That reduced the odds of near-term Fed easing. By market estimates, the probability of a rate hike by year-end stands at 30%.
21Shares analyst Matt Mena noted that holding $80,000 is critical for the market. A break lower could test $78,000 and then $75,000.
What about ETFs?
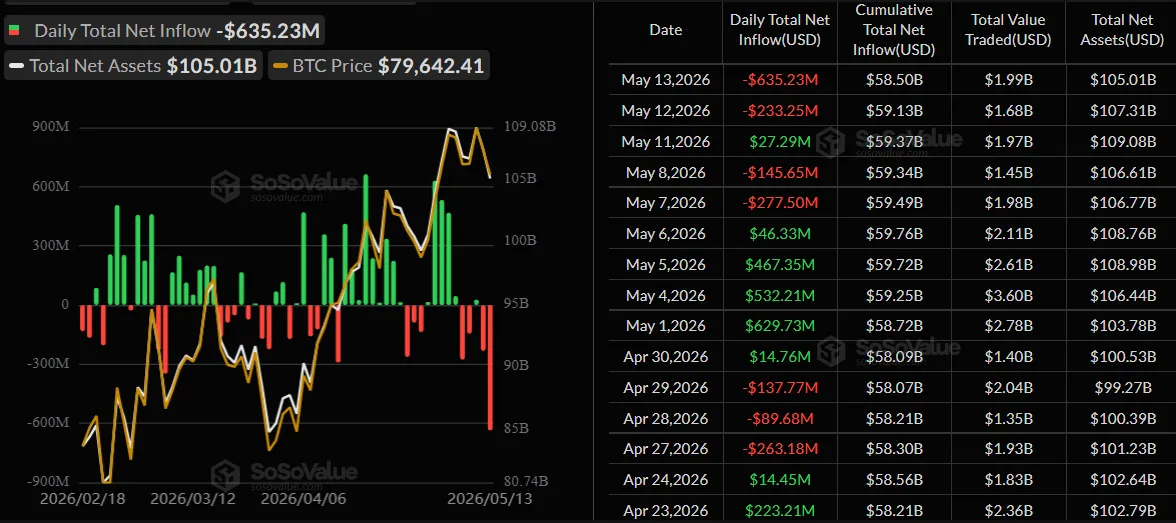
The drop was accompanied by outflows from institutional products. On May 12, net outflows from spot bitcoin-ETF totalled $233.25m, and on May 14 — $635.23m, the largest since mid-February.

In the Ethereum fund segment, May 12 saw an outflow of $130.62m and May 13 of $36.3m.
According to Glassnode, the seven-day average daily net outflow over the past week was $88m.
The 7D-SMA of US Spot ETF Netflow dropped to -$88M/day, the largest outflow since mid-February.
February's outflows occurred into price weakness. This wave is selling into strength, with BTC trading near $80k.
Institutional participants were using the recovery over the recent… https://t.co/BlsOLfq7yE pic.twitter.com/4qHLVjw7WC— glassnode (@glassnode) May 14, 2026
Analysts observed a shift in investor behaviour: in February, funds were withdrawn into price weakness, whereas now sales are occurring into strength — with bitcoin holding near $80,000.
Institutional players used the recent recovery to exit positions. In analysts’ view, this is deliberate profit-taking rather than fear or panic.
Corporate treasury activity has also eased. According to a Bitfinex report, large companies’ purchases of digital gold over the week fell by 80%. Experts warn of potential volatility in the $82,000–85,200 range due to an options overhang. Bitfinex believes the latest advance is more likely a temporary short squeeze than the start of a sustained trend.
Nexo specialists reported that amid volatility, open interest in bitcoin perpetuals fell 7% to $36.8bn, pointing to reduced leverage among traders.
Risk assets are also under pressure from the rise in the US 10-year Treasury yield to 4.46%. The market is watching Senate debate on the CLARITY Act and the outcome of US President Donald Trump’s visit to Beijing.
Other factors
An analyst using the pseudonym Easy On Chain believes that a confluence of factors — from coin inflows to exchanges to macro data — drove bitcoin’s decline.
Why Did Bitcoin Crash? What Really Happened Inside the Market
“A market weakened by falling outflows met a short-driven atmosphere and macro bad news, triggering a massive $109.7M long wipeout.” – By @easy_Vero pic.twitter.com/ZbF4NVcifI
— CryptoQuant.com (@cryptoquant_com) May 14, 2026
By May 11, the market was facing a shortage of buyers. While bitcoin inflows to exchanges remained stable, outflows fell sharply — to 19,995 BTC — well below early‑May averages (25,000–35,000 BTC). Net flows turned positive, creating excess sell-side liquidity and depriving the price of support.
From May 8 to 10, traders aggressively opened short positions — negative funding rates confirmed the bearish bet. As the price fell, a domino effect followed: over three days, $109.7m worth of longs were forcibly closed. On May 12 alone, long liquidations were 11 times greater than short losses.
The final trigger was the release of the CPI and PPI indices: US macro data ultimately sapped investor sentiment, the analyst stressed.
Easy On Chain sees limited room for recovery for now. A reversal would require a decline in forced liquidations and a return of net exchange flows to negative territory.
Whales return
Glassnode analysts recorded a return of institutional demand for bitcoin. After the drop to $60,000 and the subsequent recovery towards $80,000, inflows into US spot bitcoin ETFs turned consistently positive.
Rally Without Conviction$BTC has recovered above $80K as ETF inflows, spot demand, and positioning improve. However, weaker capital inflows and heavy overhead supply near $86K keep conviction below prior bull phases.
Read the full Week On-Chain👇https://t.co/ZKsyqqaQR5 pic.twitter.com/xjZREW5ify
— glassnode (@glassnode) May 13, 2026
During February’s decline, investors’ unrealised losses reached 25%. After the move above $80,000 they fell to 8%. In the experts’ view, the market has shifted from fear to uncertainty. If $60,000 holds, this cycle could see the “shallowest” drawdown in the asset’s history.
Capital flows
Net capital inflows to the network are about $2.8bn per month. That confirms a positive trend, but the figure remains well below the 2023–25 bull‑market levels, when inflows exceeded $10bn.
Glassnode highlighted the following key levels:
- support: $76,900 — the average cost basis of short‑term investors over the past 30 days;
- resistance: $86,900 — the zone of volume concentration accumulated from November to February.
Aggressive buying is evident on Coinbase, underscoring spot demand. Traders on Hyperliquid are also adding long positions.
Volatility is easing, and demand for downside hedges (put options) is softening. Analysts flag sensitivity around $82,000: given dealer positioning, a move into this zone could spark a sharp rise in volatility.
Experts conclude that market structure is improving, but stronger capital inflows are needed for a full‑blown bull run.
Earlier, MN Trading founder Michaël van de Poppe argued that bitcoin has no obvious reasons to fall. In his words, a false notion of a forming “bear flag” and a move to $50,000 by year-end has taken hold in the market.