

Bitcoin Price Tests $81,000 Mark
Bitcoin tested $81,000, up 1.4% in a day. Now at $80,572.
The price of the leading cryptocurrency tested the $81,000 level, appreciating by 1.4% over the day.
At the time of writing, Bitcoin’s price had retreated to $80,572.
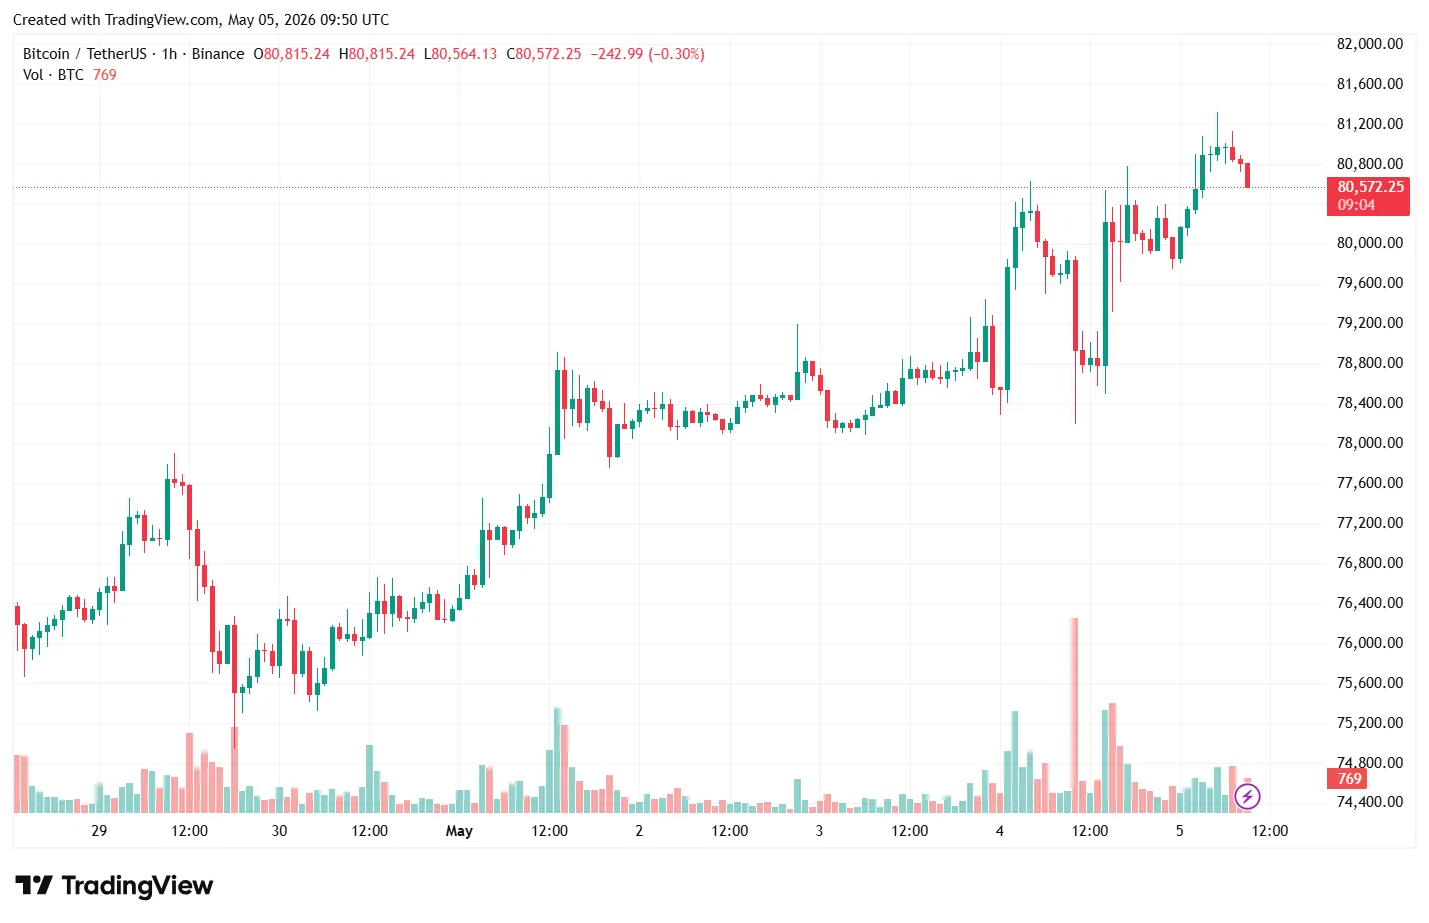
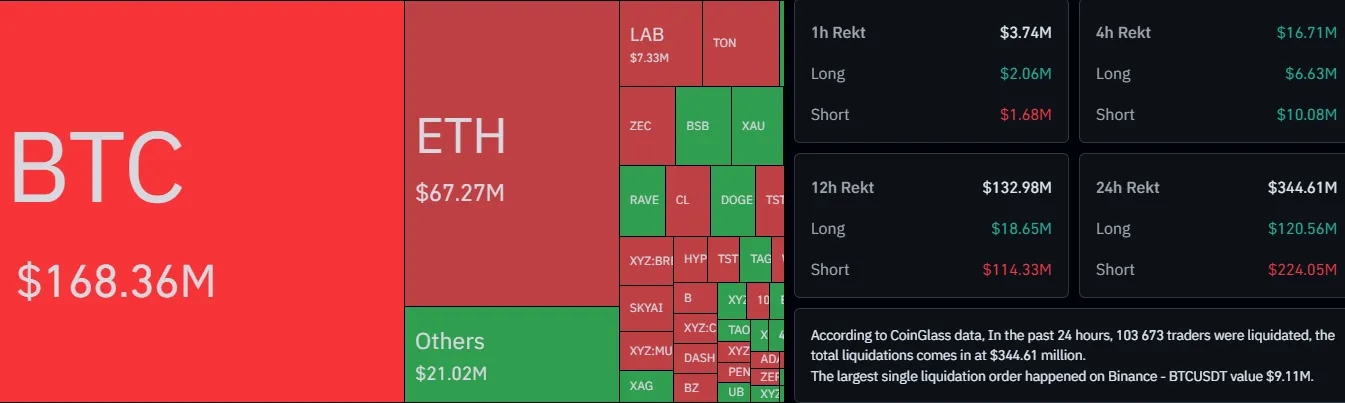
The volume of liquidated short orders in the futures market exceeded $224 million.
Is the Ice Breaking?
An expert known as Darkfost observed a capital inflow into the digital asset market. Over the past 60 days, the total cryptocurrency market capitalization increased by $5.9 billion.
Demand is still relatively weak to support a strong rebound, but it is important to note that it has improved over the past few months.
If we look at the evolution of market cap, the trend has clearly shifted.
🟢 Over a 60-day period, more than $5.9B has been added to market… pic.twitter.com/Xtuom7aH3p
— Darkfost (@Darkfost_Coc) May 3, 2026
The analyst noted that in early March, the market was losing about $2 billion monthly — now the trend has reversed. Over the past 30 days, $2.6 billion has flowed into the industry.
Demand remains moderate, but indicators have been improving for several months. This supports the market recovery that began in February.
Investor Optimism
Darkfost pointed out that a special index tracking a range from +100 to -100 has moved into the “greed” zone. The expert sees this as a positive signal: investors confident in growth are less likely to sell assets and prefer long-term holding.
🟢 We are returning to a more positive market sentiment as BTC attempts to establish itself above $80,000.
— 💡This index, which incorporates the Fear & Greed Index among other components, does not function in the same way. Its scale ranges from +100 to -100, moving from… pic.twitter.com/PWIA5lwihS
— Darkfost (@Darkfost_Coc) May 5, 2026
Darkfost urged caution, recalling the situation in January: then, a similar rise in optimism was followed by a sharp market reversal and correction.
The analyst believes the market is approaching a potential turning point. During this period, the behavior of major market participants requires special attention.
Divergence in BTC and ETH Dynamics
Experts from XWIN Japan analyzed the growth of the crypto market in April and identified significant differences in the demand structure for the two largest cryptocurrencies.
Deconstructing April’s Recovery — The Divergence in Supply-Demand Structure Between Bitcoin and Ethereum
“If ETH begins to show sustained spot demand similar to BTC, broader altcoin participation may follow. Until then, Bitcoin dominance is likely to persist.” – By @xwinfinance pic.twitter.com/UVw1bfVXAr
— CryptoQuant.com (@cryptoquant_com) May 5, 2026
Over the month, Bitcoin rose by 11.85% — from $68,219 to $76,306. Ethereum’s increase was more modest — 7.28% (from $2,103 to $2,256). Analysts at XWIN Japan termed this trend a “structural divergence.”
Key factors driving the growth of the leading cryptocurrency include:
- a positive premium on Coinbase — an indicator of demand from American institutions and ETFs;
- consistent outflow of coins from exchanges, confirming accumulation by major players.
The situation with Ethereum appears different. Analysts did not detect significant interest from funds. Ether’s price rose mainly due to reduced selling pressure rather than active buying.
XWIN Japan believes the market has ceased to move uniformly. Capital is now distributed selectively. Bitcoin’s dominance will persist until a sustained spot demand for Ethereum emerges.
On May 4, the price of the leading cryptocurrency rose to $80,500. One of the growth drivers was the change in the news background regarding the conflict between the US and Iran.
Рассылки ForkLog: держите руку на пульсе биткоин-индустрии!