


Bitcoin’s Spot Price Gap with Realized Value Narrows to 21%
Bitcoin's spot and realized price gap narrows to 21%; further 20% drop needed for bottom.
The gap between the spot and realized price of the leading cryptocurrency has shrunk from 120% at the end of 2024 to the current 21%. However, to reach the accumulation zone where the historical bottom forms, the asset needs to drop another 20%, according to data from CryptoQuant.
The average cost of all coins, considering the time of their last movement, is currently around $54,100.
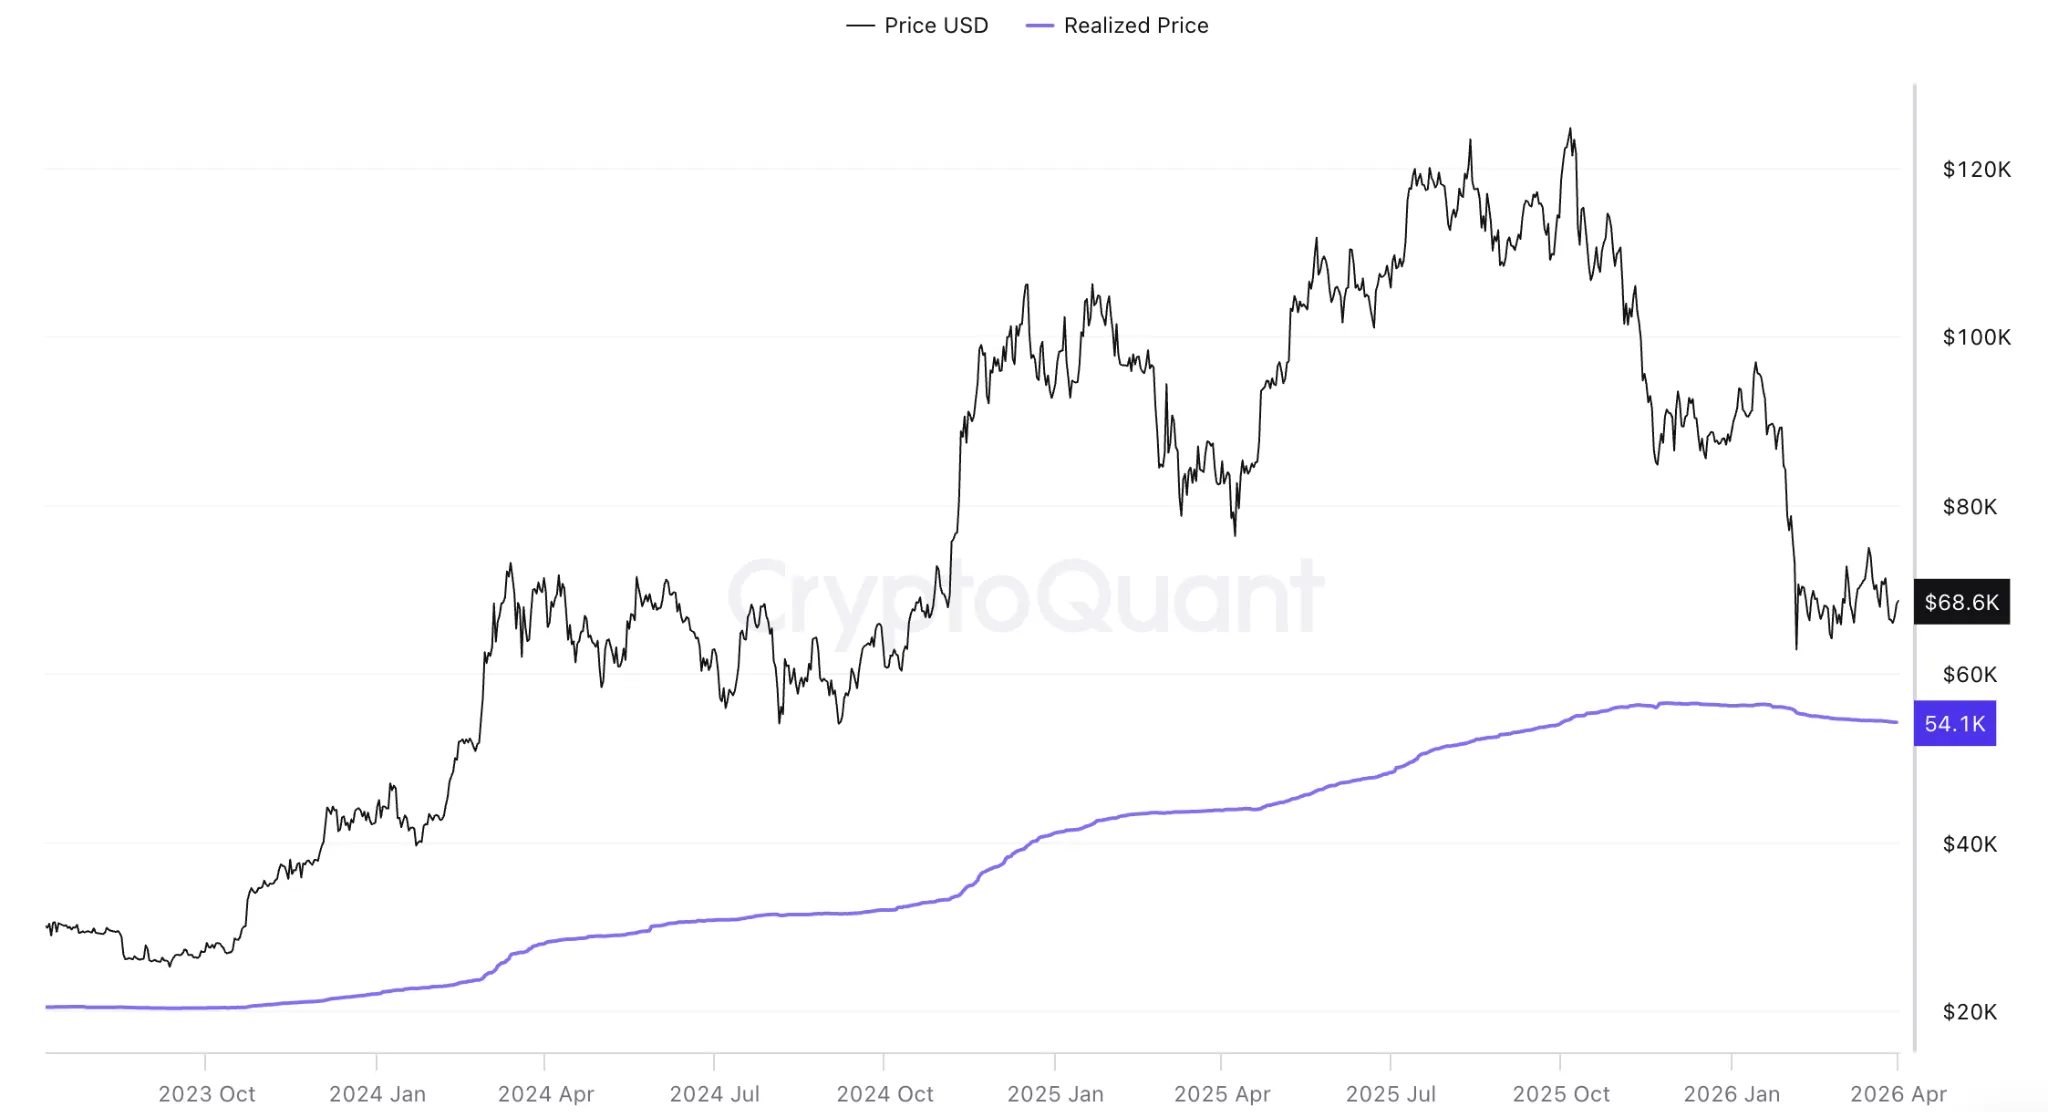
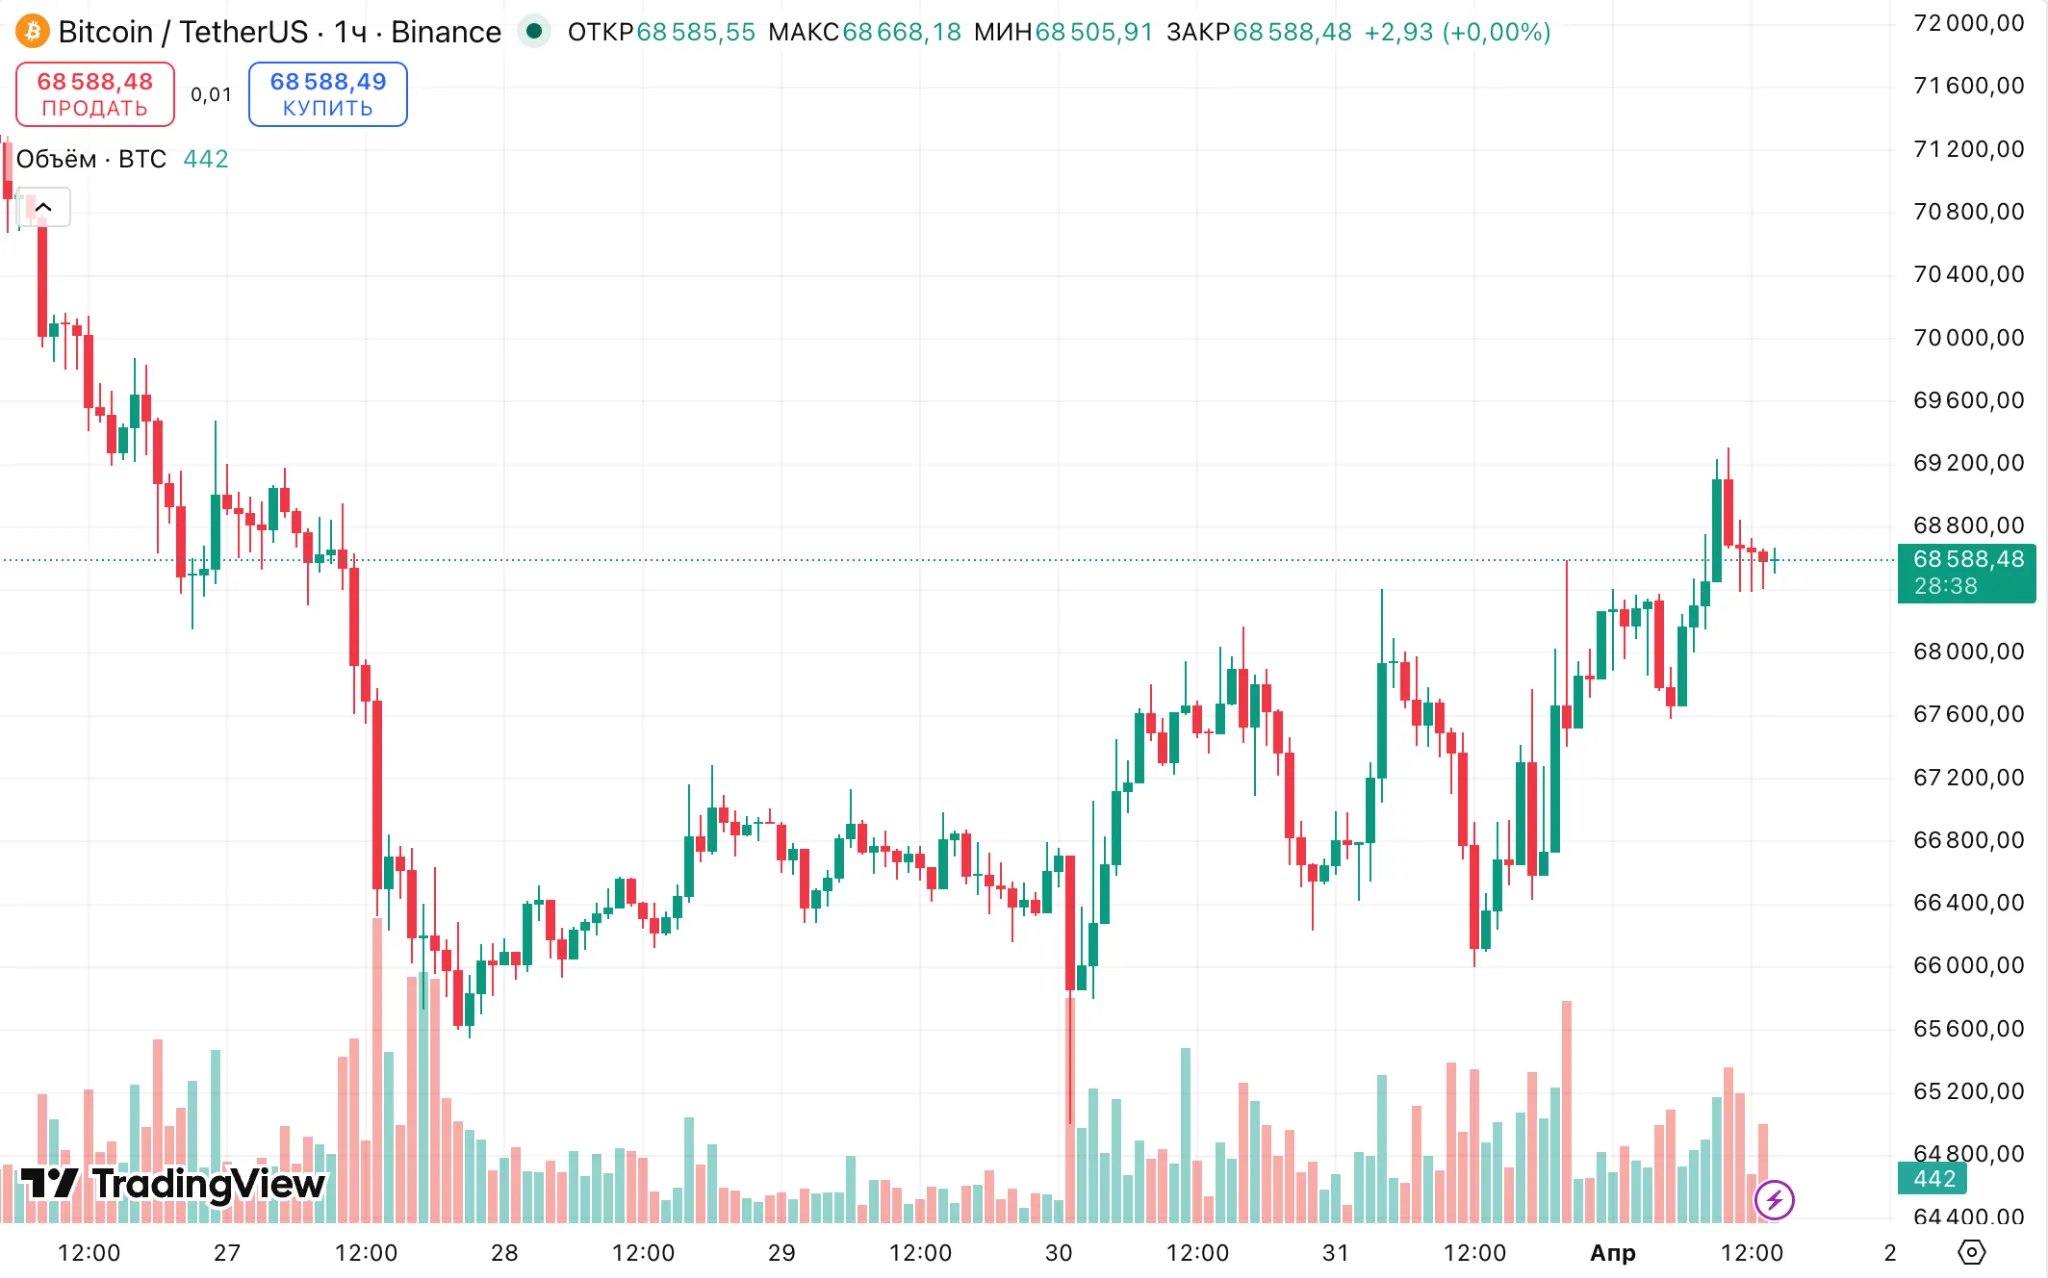
At the time of writing, the price of Bitcoin is around $68,600.
During the bear market of 2022, the signal for the bottom was the drop of Bitcoin’s spot price below the realized price. From June to October, digital gold traded below its average cost.
The maximum drawdown, when spot quotes fell 15% below the realized price, almost exactly coincided with the cyclical low of around $15,500. A similar crossing of metrics was observed at the beginning of 2020 during the market crash amid the COVID-19 pandemic.
Reset Not Complete
The current situation is different. A 20% premium to the realized price indicates that most holders are still in profit — a significant buffer. For the spot to fall to the average cost of all coins, Bitcoin needs to drop to about $54,000.
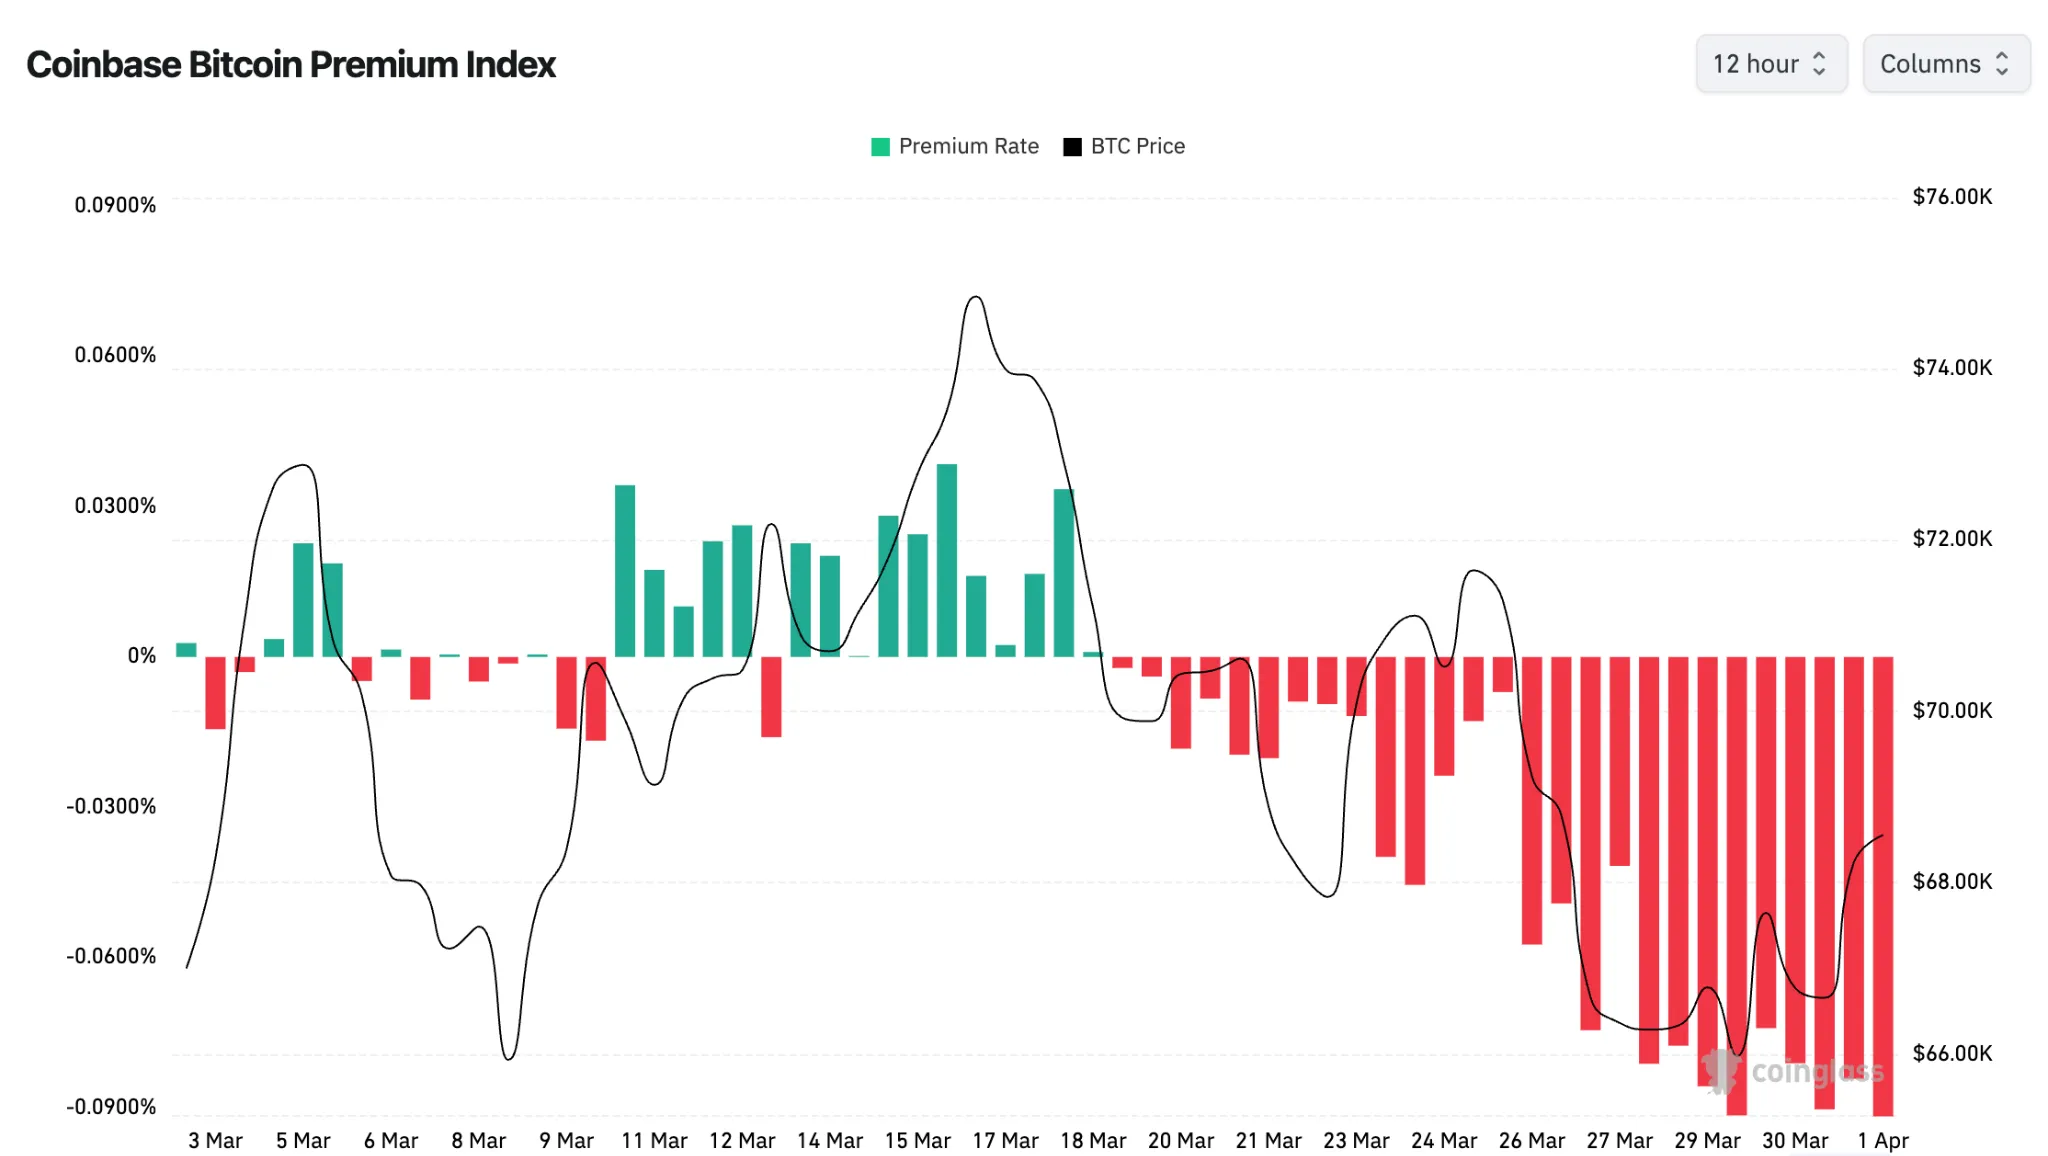
Other on-chain signals also suggest that the correction is not yet over. The Coinbase Premium Index remains in negative territory — a sign of weakening institutional demand from American investors.
According to Glassnode, the seven-day simple moving average (SMA) of the net flow of American spot Bitcoin ETF has turned negative. The daily outflow is 200-500 BTC.
The 7D-SMA of US Spot ETF Netflow has turned negative since early last week, with 200–500 BTC in net daily outflows.
Small in magnitude, but persistent. A quiet signal that institutional demand conviction remains tentative at current price levels.
📉https://t.co/wQKxJFVr9p pic.twitter.com/5H1MY411wH
— glassnode (@glassnode) March 31, 2026
“The indicator is small but persistent — a quiet signal that institutional demand at current price levels remains uncertain,” analysts noted.
Additionally, experts pointed to a decline in total daily transaction fees in the network of the first cryptocurrency. The indicator has fallen to 2.5 BTC per day — the lowest since March 2011.
The 30D-SMA of total daily transaction fees has declined to 2.5 BTC/day, the lowest level since March 2011.
Fee compression of this magnitude reflects a significant reduction in on-chain demand for block space, consistent with subdued network.
📉 https://t.co/ZozJ5REhDE pic.twitter.com/eX83xHiqdn
— glassnode (@glassnode) March 31, 2026
According to them, this trend reflects a sharp decline in demand for block space amid low user activity.
In the first quarter of 2026, Bitcoin experienced its worst performance in eight years. Over three months, the price of digital gold fell by 22.2%.
Рассылки ForkLog: держите руку на пульсе биткоин-индустрии!